In this topic you will learn about the Utilization report that is provided as part of the Analytics module.
To view the Utilization report, open the Analytics module and select Utilization from the left side navigation. When you rollover the Utilization link you can select the report dimension to display. The report will display a graph showing total bandwidth per day for the time period selected. The Metric dropdown list can be used to select another metric:
- Total Bandwidth
- Video Bandwidth
- Video Views
- Live Module Hours
The Account Utilization drop down list can be used to select the report dimension to display. The following report dimensions are available:
The bottom of the report has controls which let you select how many rows should be displayed and for navigating to other pages.
Utilization Report Details
The first column that appears in the body of the report will vary based upon the report dimension that is selected, day or video. The following data may be displayed:
- Video Views - The number of times a video started playing, recorded when the stream is started (does not include rewind or replay); it is not a measure of individual viewers
- Video Bandwidth - Includes bandwidth for videos and images
- Total Bandwidth - Includes bandwidth for videos, images and player loads
Note: For a complete list of all analytics terms and definitions, see the Analytics Glossary.
Exporting Report Data
Report data can be downloaded as both comma separated values and Excel formats.

Note that the reports support print-friendly style sheets so printing a report or saving to PDF will generate a printer-friendly page.
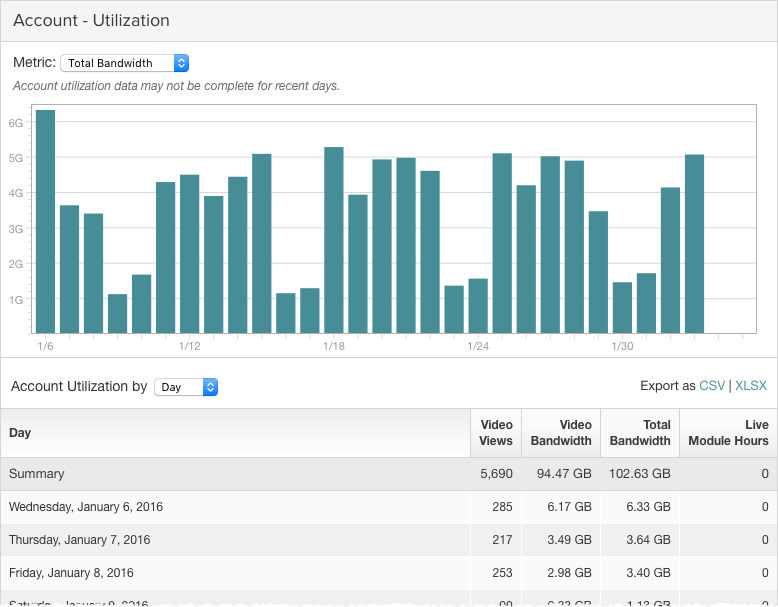
Viewing Day Analytics
When the Day dimension is selected, a graph will display the total bandwidth per day for the time period selected. The body of the report lists the date, video views, video bandwidth and total bandwidth.
Viewing Video Analytics
When the Video dimension is selected, a graph will display the total bandwidth per day for the time period selected. The body of the report lists the video name, video ID, video duration, video views and video bandwidth.
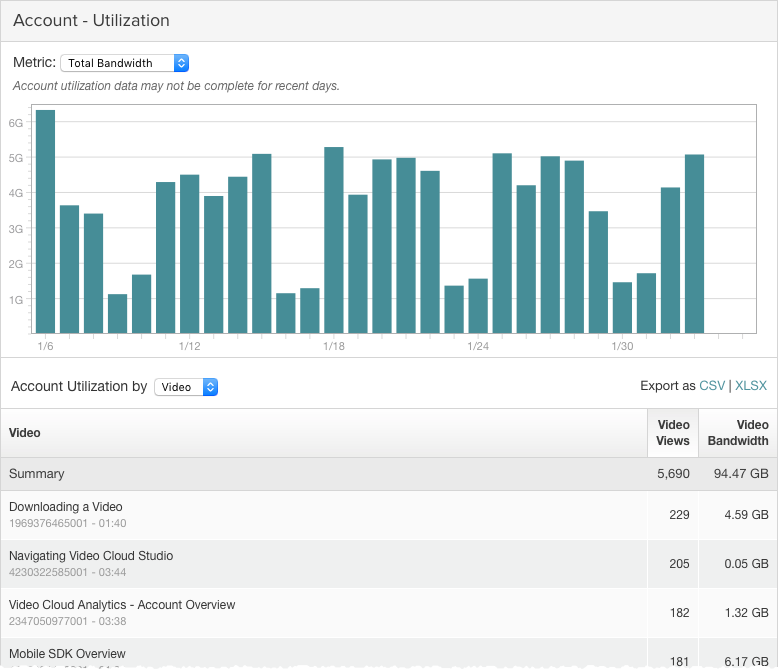
Note that a value of Other/Third Party may appear on the report. This happens when video traffic does not have a video ID associated with it. This can happen with custom applications, MRSS feeds, and delivery of non-video assets such as video stills and thumbnails. Delivering un-optimized video stills and thumbnails can greatly increase bandwidth usage. For more information on how to better size video stills and thumbnails, see Guidelines for Using Third-Party Software To Create Thumbnails and Video Stills.
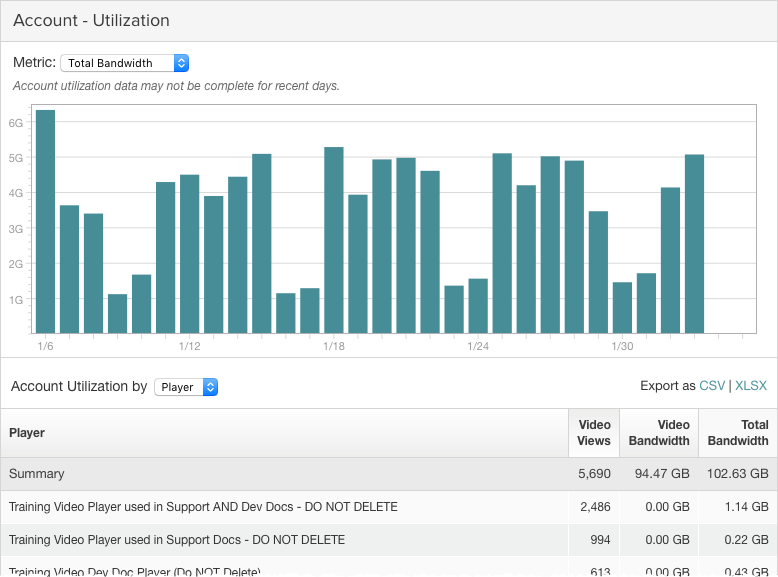
Viewing Player Analytics
When the Player dimension is selected, a graph will display the total bandwidth per day for the time period selected. The body of the report lists the player name, video views, video bandwidth and total bandwidth.